
A full event carbon footprint is rarely dominated by the audience alone. UK festival analysis puts audience travel at about 41% of the total footprint when full Scope 3 emissions are counted, while all travel combined reaches about 58%, with food and drink contributing roughly 35%. The figures vary sharply by location, venue and what an organiser includes, but they expose a practical problem: teams that focus only on visitor journeys can miss production freight, crew movements, catering and temporary infrastructure.
For UK planners, the answer isn't another broad sustainability promise. It's a defensible measurement process, followed by decisions that reduce the largest controllable sources. The approach below is designed for conferences, exhibitions, trade shows, brand activations and live experiences where suppliers, equipment and people all move through the event.
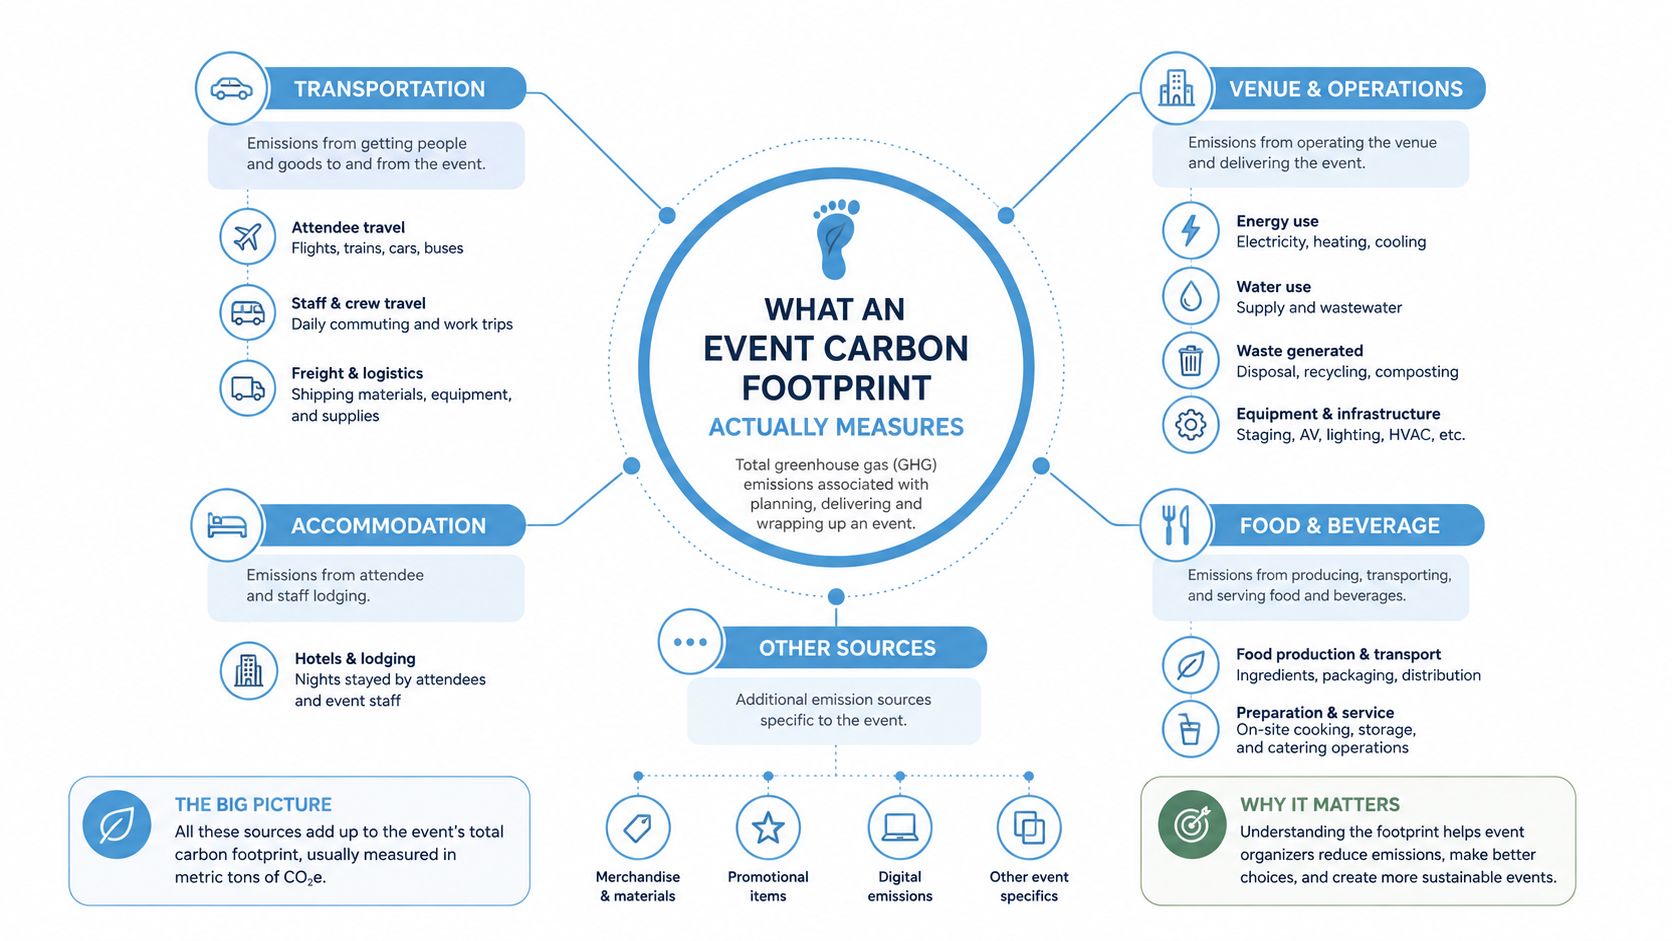
What an Event Carbon Footprint Actually Measures
The 2023 Temperature Check analysis measured 2,246 tCO2e across 127 UK-based events, with an average of about 2 tCO2e per event and roughly 6 kg CO2e per guest. The same dataset records average waste of 2.14 kg per attendee, showing how quickly a headline footprint becomes operational detail once attendance and material flows are examined. These benchmarks are reported in the Temperature Check analysis of UK events.
An event carbon footprint is the total greenhouse gas emissions generated by event activity. That includes carbon dioxide and methane, not only electricity consumed inside the venue. The Southwark Events Environmental Sustainability Guide recommends auditing separate areas such as power, transport, waste and water, rather than relying on one unexplained estimate.
The footprint follows the activity
For a trade show, the boundary may include venue electricity, stand construction, freight to the exhibition centre, hotel stays, staff travel, printed graphics, catering and waste removal. For an outdoor activation, temporary generators, road transport, build materials and crew accommodation may be more significant. An attendee's journey is part of the picture too, but it shouldn't automatically become the entire picture.
Camping festivals illustrate the difference between a narrow and broad boundary. Vision 2025's Net Zero Briefing for Event Organisers cites 1.9 kg CO2e per audience day for camping festivals, excluding travel and embodied carbon. That figure is useful as an on-site benchmark, but it isn't a complete event footprint.
Why one number isn't enough
A total tCO2e figure tells a client whether the event has a measurable impact. It doesn't tell the production manager what to change. A credible audit therefore preserves the underlying activity data, including litres of fuel, kilowatt-hours of electricity, passenger travel, freight movements, food procurement and waste quantities.
Practical rule: If you can't explain which activity produced the number, you can't use the number to manage the event.
The most useful audit is granular enough to compare like with like. Record whether travel includes attendees, staff, artists, exhibitors, suppliers and contractors. Record whether build materials are reused or purchased for one event. Record whether venue power is metered or estimated. Those choices determine whether the final figure supports a real reduction plan or merely creates a polished sustainability statement.
The Six Emission Buckets Every Planner Must Track
A practical UK event audit becomes manageable when activity is sorted into six operational buckets. The isla guide to measuring an event carbon footprint uses energy, food and drink, travel, graphics and build materials, event transport, and waste and recycling. The categories prevent common omissions, especially around temporary infrastructure and supplier logistics.
| Emission Bucket | What It Covers | Corporate Event Examples |
|---|---|---|
| Energy | Venue electricity, temporary power, fuel and equipment energy | Lighting, AV, refrigeration, simulator rigs, generators and charging equipment |
| Food and drink | Catering ingredients, preparation, service and food waste | Delegate lunches, hospitality, staff catering and brand-launch refreshments |
| Travel | Attendee, staff, crew and supplier journeys, plus accommodation where included | Rail, car, flights, taxis, hotel nights and exhibitor travel |
| Graphics and build materials | New materials, fabrication, décor, signage and temporary structures | Exhibition stands, branded walls, vinyl, timber, carpet and scenic elements |
| Event transport | Freight and logistics associated with getting equipment and materials to site | Trucks carrying rigs, road cases, stand parts, courier deliveries and overseas freight |
| Waste and recycling | Disposal, recycling, treatment and associated waste streams | Food waste, cardboard, carpet, packaging, damaged graphics and dismantled builds |
Start with the data owner
Assign one person to each bucket before suppliers are appointed. The production manager normally owns energy and event transport, the creative or brand lead owns graphics and build materials, the caterer supplies food data, and the event or travel manager coordinates attendee and staff travel. The venue should confirm metered electricity or its best available allocation.
This ownership matters because suppliers often hold the evidence. A freight company may know vehicle type, distance and load, while a stand contractor knows material weights and reuse routes. Asking for the data after the event usually produces estimates, missing invoices and conflicting assumptions.
Track activity, not impressions
For a simulator activation, energy data might include the venue supply used by the rig, display screens and charging equipment. A brand launch may need catering quantities, menu composition, food waste and delivery information. An exhibition build can involve several separate movements, including fabrication, warehouse transfers, venue delivery and collection.
Keep those records separate. Combining every supplier invoice into a single “production” line makes it impossible to identify whether the main opportunity is material reuse, shipment consolidation or equipment power.
A useful audit file has one worksheet per bucket, a source column for every figure, and an assumptions column. If a supplier can't provide a measured quantity, record the estimate, explain how it was formed and mark it for improvement at the next event. Transparent uncertainty is more credible than false precision.
Why Audience Travel Is Not the Whole Story
The idea that audience travel accounts for roughly 80% of an event's footprint is too blunt for serious UK planning. A UK-focused festival analysis found audience travel averaged about 41% when full Scope 3 emissions were included, while all travel and transport reached about 58% and food and drink averaged roughly 34%. Those figures appear in the AGF Festival Carbon Footprint Report.

The boundary changes the answer
Audience travel remains important, particularly when a venue attracts people from distant locations or offers poor public transport access. But a full Scope 3 view also counts production crews, artists, exhibitors, traders, suppliers, freight and catering supply chains. Excluding those movements doesn't reduce emissions. It hides them from the calculation.
The variation is substantial. Audience-travel share ranged from about 35% to 94% across assessed events, reflecting differences in venue location, audience geography, transport modes and reporting boundaries, as detailed in the AGF sector analysis. A rural activation with limited rail access may produce a very different profile from a city-centre conference beside a major station.
Prioritise what the organiser can influence
A planner can't control every attendee's home address, but can influence the venue, event schedule, travel information, accommodation pattern and format. A hybrid event planning approach can also reduce some journeys where in-person attendance isn't essential, although digital delivery still needs sensible production and energy decisions.
The organiser has more direct control over supplier logistics. Ask whether shipments can be batched, whether a local supplier can replace a long-distance movement, whether equipment can stay on site between event days, and whether build components can be reused. Catering specifications are equally actionable. Menu design, procurement, portion planning and redistribution can change the food-related profile without reducing hospitality quality.
Transport is a system, not a single line item. Measure the people and goods moving to the event, then decide which movements are genuinely necessary.
The right question isn't “How do we eliminate audience travel?” It's “Which sources are large, repeatable and within our operational control?” That framing produces a more balanced reduction plan and stops efficient venue lighting from receiving attention that should have gone to freight or menu design.
Calculating Your Event Footprint Using UK Conversion Factors
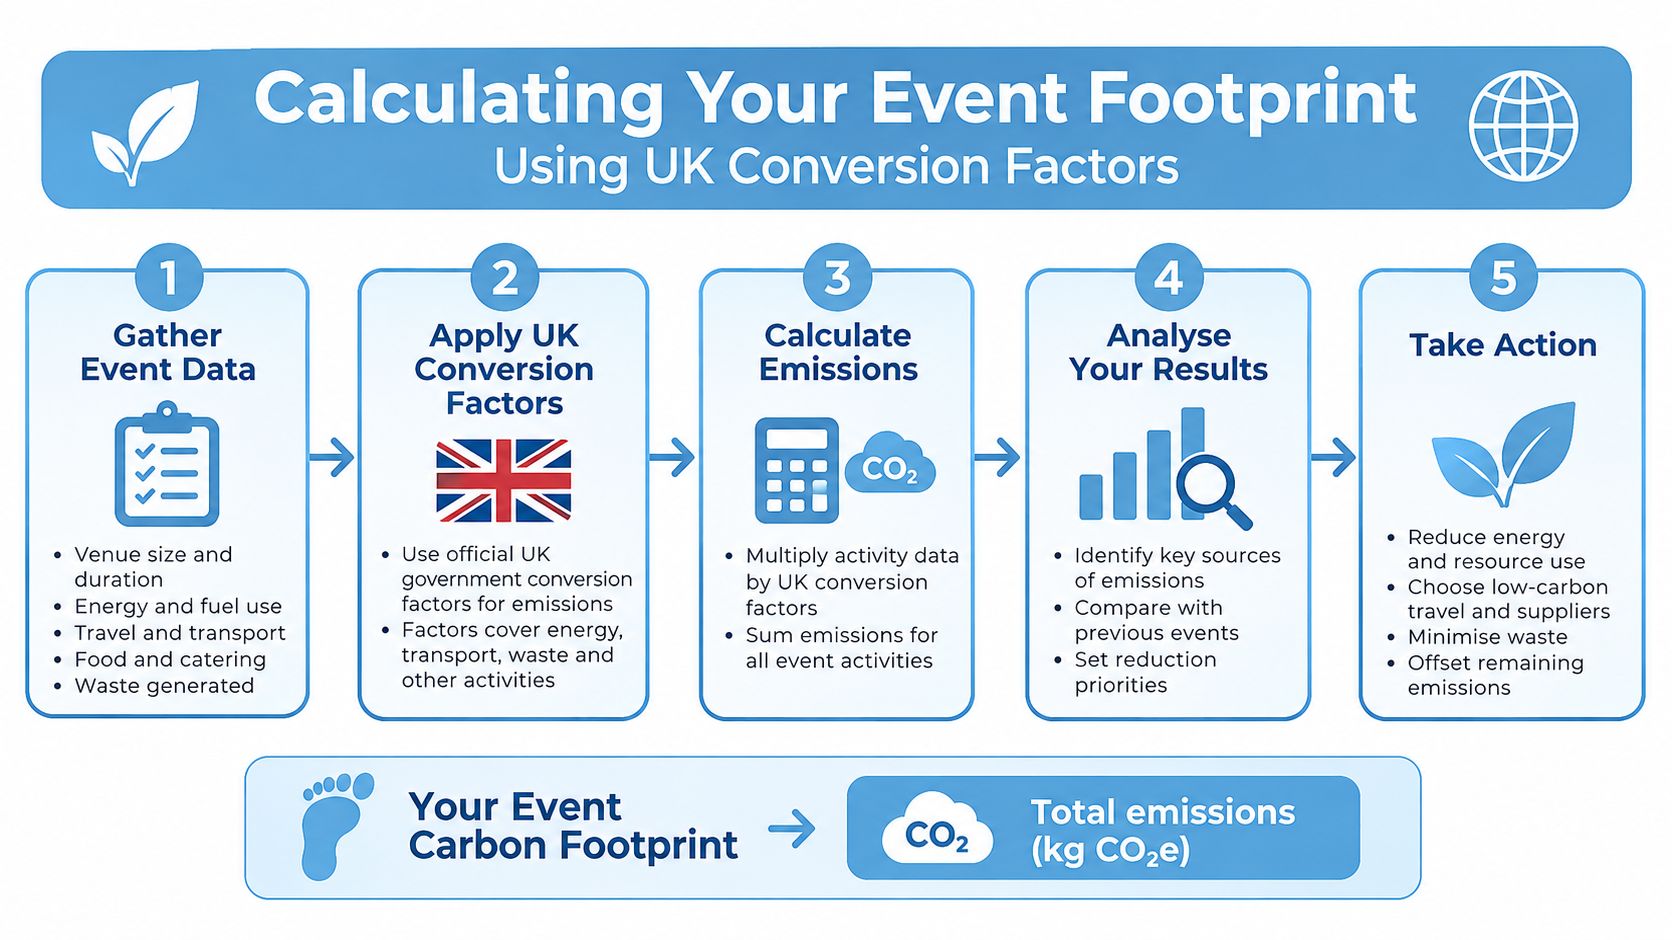
A defensible calculation starts with activity data, not a generic event label. The UK Government publishes annual conversion factors for fuel, electricity, travel, freight, waste and related activity through the Department for Energy Security and Net Zero. The UK GHG conversion factors resource explains their role as standard factors for converting UK activity data into greenhouse-gas emissions.
Build the calculation in five stages
Set the boundary. Define the event dates, site, suppliers, attendee groups and activities included. State whether accommodation, audience journeys and upstream materials are counted.
Collect activity data. Request venue electricity in kWh, generator fuel in litres, travel in passenger-kilometres or journey records, freight in vehicle distance and load information, food quantities where available, and waste by weight and treatment route.
Choose the matching factor. Apply the current UK factor for the relevant fuel, electricity supply, travel mode, freight activity or waste treatment. Do not use a global average just because it is easier to find.
Convert each line. Multiply each activity quantity by its applicable factor, retain the factor's unit, and convert the result into a consistent CO2e unit. Keep a reference to the factor year and source beside the calculation.
Add and review. Sum the category results into a total tCO2e figure, then review the breakdown. Check for duplicated freight, missing return journeys and supplier activities recorded in the wrong bucket.
A worked calculation without invented factors
Consider a mid-size UK exhibition with diesel generators, venue electricity, staff flights and waste. The event team records the actual litres of diesel, the actual kWh of venue electricity, staff flight passenger-kilometres, and tonnes of waste. Each quantity is entered against the current UK Government factor for that activity, producing four separate CO2e results before they are added to the wider event ledger.
This is the correct worked method, but the final numerical emissions result depends on the quantities recorded and the applicable annual factors. Without those inputs, assigning a made-up result would create false accuracy. The team should therefore publish the activity quantities, factor year, calculation boundary and assumptions alongside the total.
Use the same logic for supplier freight. A truck journey should not be represented by a rough “delivery charge”. Ask for distance, vehicle information and, where practical, load details. If the supplier can only provide an estimate, label it clearly and improve the request in the next procurement cycle.
UK-specific factors matter because electricity, fuels, travel patterns and waste treatment vary by country. Updating the factor set each year also helps event teams explain why a reported footprint may change even when operational activity appears similar. A calculation is a management tool, not just a final figure for a presentation.
The Avoid Reduce Offset Hierarchy for Event Teams
The mitigation hierarchy keeps event decisions in the right order: avoid unnecessary activity, reduce the emissions that remain, then address residual emissions responsibly. Offsetting should never be the first response to a freight-heavy build, an inaccessible venue or a menu designed without carbon considerations.

Avoid before you optimise
Avoidance changes the event brief itself. Choose a venue close to public transport, plan schedules that allow people to make fewer separate journeys, and question whether every physical item needs to be manufactured and shipped. Batch production deliveries so a supplier makes fewer movements, and consider whether equipment can be hired locally rather than transported across the country.
Venue accessibility often matters more than a small improvement to on-site lighting. A highly efficient venue can still create a difficult travel pattern if most guests, crew and suppliers need long car or taxi journeys. Conversely, a well-connected venue may reduce travel demand before any technical upgrade is made.
Reduce the remaining demand
Reduction is operational. Use LED temporary lighting where the specification allows it, meter temporary power, and switch equipment off rather than leaving it energised between sessions. Specify lower-carbon catering, favouring menus with more plant-based choices and tighter portion planning, while retaining suitable options for dietary and cultural requirements.
Reuse exhibition graphics, modular structures, flooring and scenic elements. Ask suppliers to design for disassembly and future use rather than a one-off branded finish. The vendor selection criteria for sustainable event procurement can help teams build questions about data quality, reuse, logistics and material specifications into the tender process.
Practical household choices follow the same logic. The guide to carbon reduction for your lifestyle is useful context for explaining why avoiding demand usually has a stronger foundation than paying for a compensating claim.
Treat offsetting as residual management
Some emissions may remain after sensible avoidance and reduction. If an organisation chooses to support a carbon project, it should disclose the residual quantity, project details, accounting boundary and the fact that the activity doesn't erase the event's physical emissions. Avoid language that suggests a payment makes a high-emission event impact-free.
The hierarchy works because it connects procurement, design and logistics. It turns sustainability from a post-event claim into a set of choices made before contracts are signed.
Reporting Your Footprint with Credible KPIs
A credible event sustainability report gives decision-makers enough context to understand both the result and its limitations. The core KPI is total tCO2e, but it should sit beside emissions per attendee, emissions per audience day where that metric suits the format, and a breakdown by the six emission buckets.
The reporting process is becoming more data-led. isla's European Temperature Check Report 2025 describes a data-backed snapshot of UK and European business events, while Green Events Code guidance expects organisations to measure impacts annually and put travel-reduction plans in place by 2025. For planners, that means a sustainability statement without a boundary, methodology or activity record is increasingly difficult to defend.
A usable reporting template
Structure the report in four parts:
- Event profile: State format, venue, dates, attendance basis and whether the calculation covers attendees, staff, suppliers, freight, accommodation and catering.
- Results: Show total tCO2e, the chosen intensity metric, and each emission bucket as a separate result.
- Method and assumptions: List data sources, conversion-factor year, estimates, exclusions and supplier gaps.
- Action plan: Name the reduction measure, owner, delivery date and the KPI that will show whether it worked.
Avoid comparing two events because they share a client name. A city-centre conference and a rural activation have different travel profiles, build requirements and operating conditions. Compare like with like where possible, and explain changes in format or boundary before claiming improvement.
Event coordination software can help teams retain supplier records, schedules, delivery data and ownership in one workflow. A platform such as event coordination software for production teams is most useful when the sustainability fields are embedded in the same process as budgets, timings and supplier management, rather than kept in a separate spreadsheet nobody updates.
Set a year-on-year target only after establishing a reliable baseline. Report progress transparently, including increases caused by a larger build, longer opening hours or a wider calculation boundary.
Your First Event Carbon Audit in Practice
Start with one event cycle, not a perfect corporate programme. For a brand activation at a UK exhibition centre, the project lead can create the audit during the initial schedule build, before the supplier brief is issued.
Before the event, the production manager records venue power arrangements, temporary equipment, delivery routes, vehicle movements and planned collections. The creative lead records new graphics, scenic materials and reuse plans. The catering contact supplies menu and waste information, while the travel owner gathers staff, crew and supplier journey data. The venue should confirm electricity information and waste routes.
During the event, keep delivery notes, fuel receipts, meter readings, collection records and catering adjustments. Ask the site manager to record late deliveries, replacement items and additional equipment. Those changes often explain why the final footprint differs from the original plan.
Afterwards, the project lead should gather supplier returns, reconcile invoices against actual movements, enter missing data as clearly labelled estimates and save the assumptions. Don't hide a gap because the data isn't perfect. An estimated freight distance marked as an estimate is more useful than an omitted freight movement that makes the event look cleaner than it was.
Review the largest buckets at the close-out meeting. Choose one avoidance action and one reduction action for the next event, assign owners and add the data request to the procurement checklist. A rough first audit that captures the major sources will improve the next brief far more than a perfect audit that never leaves the planning stage.
PSW Events can help corporate teams plan and deliver interactive activations with logistics, installation, staffing and compliance managed as one production workflow. Visit PSW Events to explore simulator hire and event entertainment that can be planned with clearer supplier coordination and a more accountable event carbon footprint.